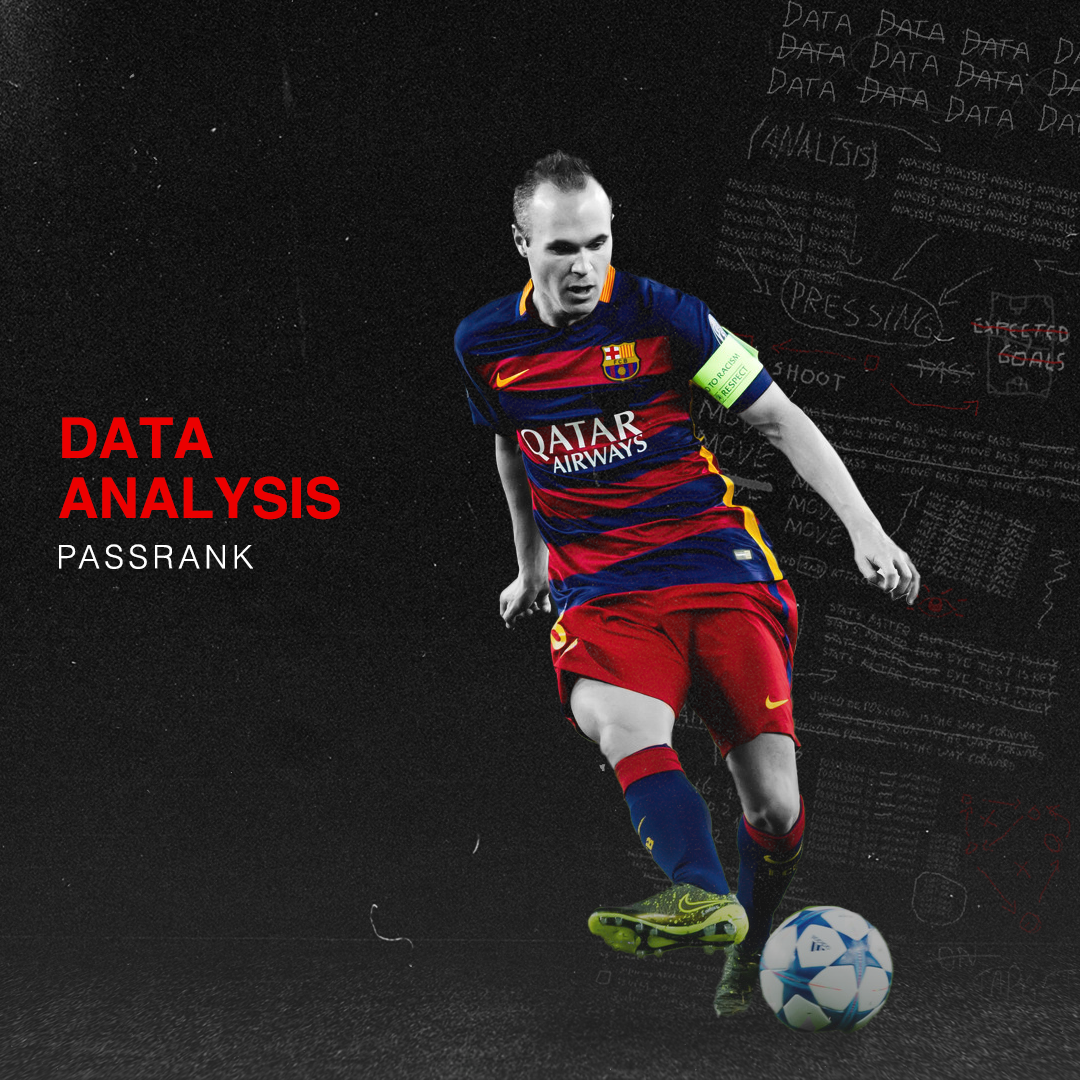
Hey Google, Who’s the Most Important Player in Barcelona’s Build-up Play?
Google is one of the world’s most valuable companies, with an unquestionable hold over the search engine market, and influence in many other areas. There are many stats that show just how big Google is, but this hardly seems like something that needs to be proven. Everyone knows Google!
When you ask Google a question, it searches an index of web pages and returns results depending on its ranking algorithm, which depends on over 200 parameters. It is likely that many of these are unique to Google, but Google’s founders – Larry Page and Sergey Brin – only wrote an academic paper about one: PageRank.

Photo: Ralph Orlowski / Getty Images
Page and Brin’s impact has not been limited to search; PageRank has been adapted for many uses beyond the web, from finding the leaders of terrorist networks to optimising engineering based on traffic flow. PageRank gives a measure of the quality of any webpage, or person, or stop-sign – and it can be used in football too, to find the most crucial player in a passing network, in a metric we will call PassRank.
The basic idea of PageRank is that the importance of any web page can be judged by the pages that link to it. If there are many pages that link to a specific page, it is likely that the page is both relevant and important, and that it is a trustworthy source of information.
This is even truer if the pages that are linking to the site are themselves respected – an important site has a reputation to uphold, which would be damaged if it were linking to poor quality sites, or sites that did not add any useful information. As a result, a score can be assigned to every page, based off the scores of the pages that link to it.
Likewise, if many players pass to a central figure, then it is likely that he is pretty good, especially if the players passing to him are themselves good – and so more likely to have made the right decision when distributing the ball.
How does this work in practice? We can represent the passes between players in a team via a directed graph, with edges for passes and weights representing the number of times each pass is made. This graph can be summarised by a transition matrix, �, whose entries give the proportion of passes that a given player made to a particular recipient.
To illustrate this, consider the reduced network of Arsenal attackers below, taken from the Arsenal v West Ham match on the opening day of the 2015-16 season.
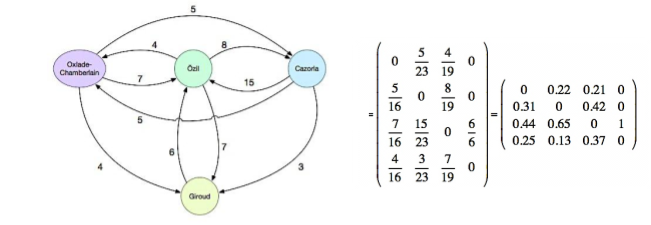
Let us now follow the ball in a random series of passes. It can start at any player with equal probability – say it starts with Santi Cazorla. Of the 23 passes Cazorla made (to another attacker) all game, 15 went to O, giving a probability of !”#$that the ball will be at Mesut Özil after one pass; likewise, it will be at Alex Oxlade-Chamberlain or OlivierGiroud with probabilities “#$and $#$ respectively. So if we represent the probabilities of each player having the ball by a vector, we get:

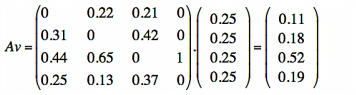
After two passes, the probability is given by �#�%, and so on. Given certain conditions, which are normally satisfied, the sequence �$�%, �&�%, … eventually converges to equilibrium – in this case, with Özil being the most likely player to have the ball.
We also have to account for the chance that the team loses the ball and wins it back. Initially, we represent this by the value �, set to be the probability that an attempted pass is successful. We then restart with the vector of equal probabilities. So our update rule is in fact:
v(k+1)1-α Tv(k)+α v0
What is the point of this? Well, it gives us an idea of how central each player is in a team’s attacking build-up play, and of how often their teammates look to pass them the ball. As a consequence, we can also see if a team over-relies on certain players, and who to close down more carefully when we are defending. To test the method, consider the results when applying it to Barcelona in 2014-15:
Rank Player PassRank
ScoreRank Player PassRank
Score
| Rank | Player | PassRank Score | Rank | Player | PassRank Score | ||||
| 1 | Messi | 0.10 | 9 | Iniesta | 0.06 | ||||
| 2 | Alves | 0.07 | 10 | Piqué | 0.05 | ||||
| 3 | Neymar | 0.07 | … | … | … | ||||
| 4 | Busquets | 0.07 | 20 | El Haddadi | 0.01 | ||||
| 5 | Alba | 0.07 | 21 | dos Santos | 0.01 | ||||
| 6 | Xavi | 0.07 | 22 | Sandro | 0.01 | ||||
| 7 | Rakitić | 0.06 | 23 | Vermaelen | 0.01 | ||||
| 8 | Mascherano | 0.06 | 24 | López | 0.01 | ||||
We can see that Lionel Messi is at the centre of most attacks, unsurprisingly, and there is also a strong preference to utilise the full-backs and Neymar from the left wing. Players like Sergio Busquets, Xavi Hernández and Ivan Rakitić act as pivots for attacks, helping to recycle possession.
Predictably, defenders and goalkeepers are least central; perhaps more unexpected is that Luis Suárez is also relatively low down, ranked 12th, since he tends to finish attacks, rather than help in the build-up.
There are a couple of ways we can modify this to address slightly different questions. First, we can weighted passes by Expected Threat (xT) gain instead, to see which players are key to creating dangerous attacks – rather than just in recycling possession. (We do not need to normalise now, as players should not be punished for a large total xT gain.)
Rank Player xT PassRank
ScoreRank Player xT PassRank
Score
| Rank | Player | xT PassRank Score | Rank | Player | xT PassRank Score |
| 1 | Iniesta | 0.25 | 9 | Vermaelen | 0.04 |
| 2 | Mascherano | 0.24 | 10 | Roberto | 0.04 |
| 3 | Neymar | 0.18 | … | … | … |
| 4 | Xavi | 0.16 | 20 | Bravo | -0.01 |
| 5 | Mathieu | 0.07 | 21 | Rakitić | -0.03 |
| 6 | Montoya | 0.07 | 22 | Pedro | -0.04 |
| 7 | Alves | 0.06 | 23 | Busquets | -0.09 |
| 8 | Rafinha | 0.06 | 24 | Messi | -0.12 |
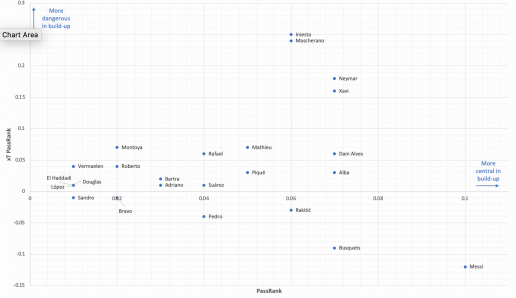
The results show that Andrés Iniesta was most influential in creating attacks, as were Neymar and Xavi. Some players have negative values, because they tended to recycle the ball instead of increasing the threat of an attack.
Most interestingly, Messi is at the bottom of the list. This is most likely because he often dribbles or shoots, which aren’t accounted for in the xT model, and because he picks the ball up in dangerous positions, so his passes have little xT available to gain. Because of these limitations, the xT results are most meaningful for midfielders.
Looking at the tables together also shows us something about the efficiency of players – Iniesta is clearly very good at creating chances out of relatively little, whereas Busquets, who is high in the first table but low in the second, receives the ball a lot but is not as attacking-minded.
We could have also optimised the values of � (how often the team restarts an attack) and �% (for example, to favour positions or players that start with the ball more often). But even without these improvements, this is a tool that can highlight players who are critical in a team’s attacking play, and therefore should be shut down or even man-marked by the defence – especially early in an attack.
By: Joshua Silverbeck
Featured Image: @GabFoligno / Alex Caparros / Getty Images