The Statistical Ranking of Europe’s Top 5 Leagues
There’s no doubt in most football fan’s minds; the top five European leagues are the Premier League, Serie A, Ligue 1, the Bundesliga, and La Liga. For some perspective, the market value of the top 20 European leagues outside the ‘Big…

Illustrator Gabriel Foligno Photographer John Berry - Getty Images Alexander Hassenstein - Getty Images Publication NurPhoto
There’s no doubt in most football fan’s minds; the top five European leagues are the Premier League, Serie A, Ligue 1, the Bundesliga, and La Liga. For some perspective, the market value of the top 20 European leagues outside the ‘Big Five’ is £7.6 billion. You have to triple that figure to reach the £23 billion value of the Big Five. Their reach and influence are unparalleled. Yet the quality of each league has become hotly debated.
Arguing about it should feel pointless. These leagues represent the pinnacle of European football, and to say there are large gaps in quality between the Big Five is a claim based on pure subjectivity. Except this topic can often become a logo of your football watching habits, and a topic fans will argue deeply about. Ligue 1 has regularly been taunted as a “Farmers League” by Premier League fans on social media, while La Liga fans may label those taunts as arrogant, and The Premier League as overrated.
Surprisingly, there has been very little work committed to calculating the differences in quality between the Big Five. The work ranges from Sportskeeda’s subjective historical view to Statista’s $500 dossier based on market value and attendances. A clear, pure-quality driven statistical answer is lacking. Before aiming to answer it, we must tackle our one official reference point.
UEFA's Coefficient Ranking
The largest authority regarding this question is UEFA and their coefficient system. The measure was introduced in 1979, and the calculations have hardly changed since. A team will get 2 points for their football association for every win in the Champions League or Europa League, and a point for a draw. This helps explain why England sits atop the ranking; since 2019, Chelsea, Manchester City, Tottenham, and Liverpool have reached the Champions League final.
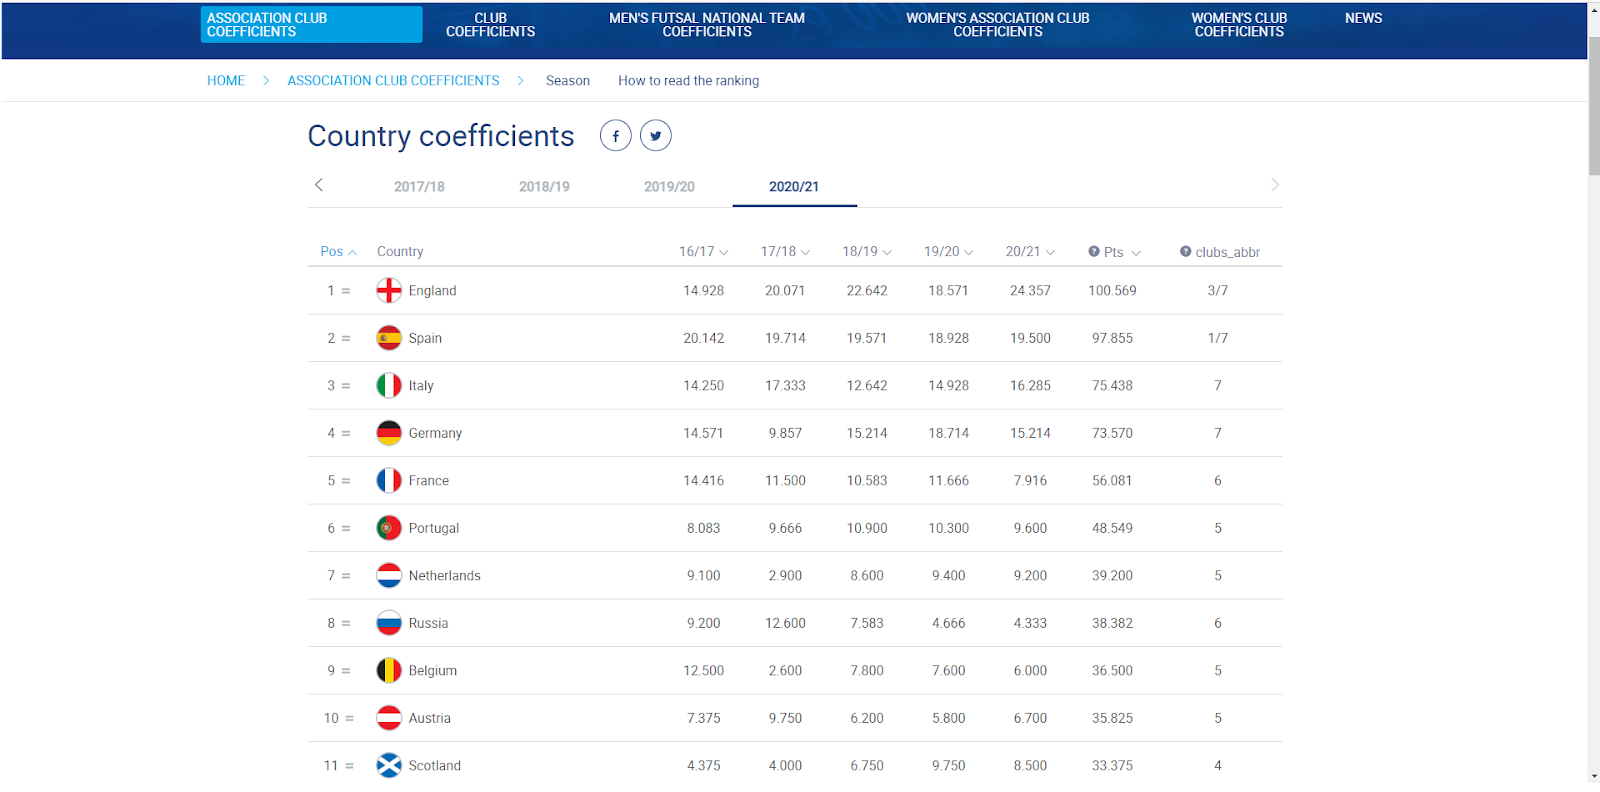
UEFA ranks the Big Five as: 1. England 2. Spain 3. Italy 4. Germany 5. France.
This makes sense at face value. The Premier League has collected more money than any of its competitors through TV rights deals for a number of decades now. Even finishing 4th in 2013 netted Arsenal £57 million. Clubs qualifying for UCL spaces were rewarded heavily, and therefore able to reinvest that money into more players, which attracted wider TV Audiences, and so on.
Being the richest also arms a club well for European competition. Smaller clubs like Rennes struggle more with the weight of European competition on top of domestic expectations. They cannot rely on falling down the league table, and these clubs will often rest their top players in European ties. Their first team may be as good or if not better than their opponents, but it’s more logical and smart to pursue domestic targets than gamble on winning a Cup Competition. See Leicester vs Slavia Prague and Lille vs Ajax in last year's Europa League for example.
Then on the flip side of this imbalance, you have teams like Bayern Munich, PSG and Juventus. Between them, they have won 24 of their last 27 domestic campaigns. Bayern Munich can afford to rest players in the Bundesliga and save their first-team players for Champions League matches. When Bayern played Lazio in last year's edition, Lazio opted to rest their star striker Ciro Immobile for the second leg.
Simone Inzaghi is thought to have prioritised the next league game against Udinese; meanwhile, Bayern benched Leon Goretzka, Leroy Sané and David Alaba in league games before both UCL legs. It actually cost them in a 1-3 defeat to Frankfurt. Yet the Bavarians won the tie against Lazio 6-2 on aggregate and won the Bundesliga by 13 points.
/@btl/leon-goretzka-the-all-action-pressing-machine
Despite the coefficient being refreshed every 4 years, these UCL and UEL matches are still a relatively small sample size. Rather than measuring the average quality within a league, or even the quality of its best teams, it’s a measure of the number of resources a football team has, or is willing, to divert to European competition which nine times out of ten a team loses. It’s not representative of league quality, especially regarding mid-lower table teams, and it should be ignored in ranking the Big Five.
The Method
We gathered our data through FBREF; It was fair to gather each league's statistics from the same provider. Selecting the measures was tricky. Goals-per-game for example, is not a reflection of a player’s ability to finish, otherwise the Belarus first division would finish with a markedly differently number compared to the Premier League. (It doesn't: 2.67 vs 2.69 GPG).
Even using advanced statistics like tackle success rate is a risky measure. If the Bundesliga’s average tackle success rate is better than the Premier League, are Premier League attackers better? Or are Premier League defenders better at reading the game to not have to make tackles in the first place?
The statistics we selected then had to avoid this double standard as much as possible. We also averaged each statistic from over the past 4 seasons (17/18-20/21). This was to eliminate single-season bias and give us a larger sample size, whilst remaining relevant. This helped us obtain some fairly staggering results, and make some objective conclusions.
Goalkeeping Standard: Post Shot Expected Goals minus Goals Allowed
Expected Goals is a model used to gauge the quality of a chance created. There are different models, but they generally follow the same format, examining thousands of shots from hundreds of different positions on a football pitch in top-level football, and determining an average likelihood of a goal from each position. For example, if 770 of 1000 penalties in Europe’s top 5 leagues are scored, that gives a penalty a value of 0.77.
Post shot expected goals tweaks this. Opta defines it as examining what happens after the ball leaves the striker's foot. If the shot is a scuffed effort, the PSXG will be low. If it is a rocket headed to the top corner, it is given a higher value. The idea is simple; goalkeepers who have conceded more goals than their PSXG allowed, have let in more goals than they should have. We determined the PSXG – Goals Conceded value for the average goalkeeper from each league.
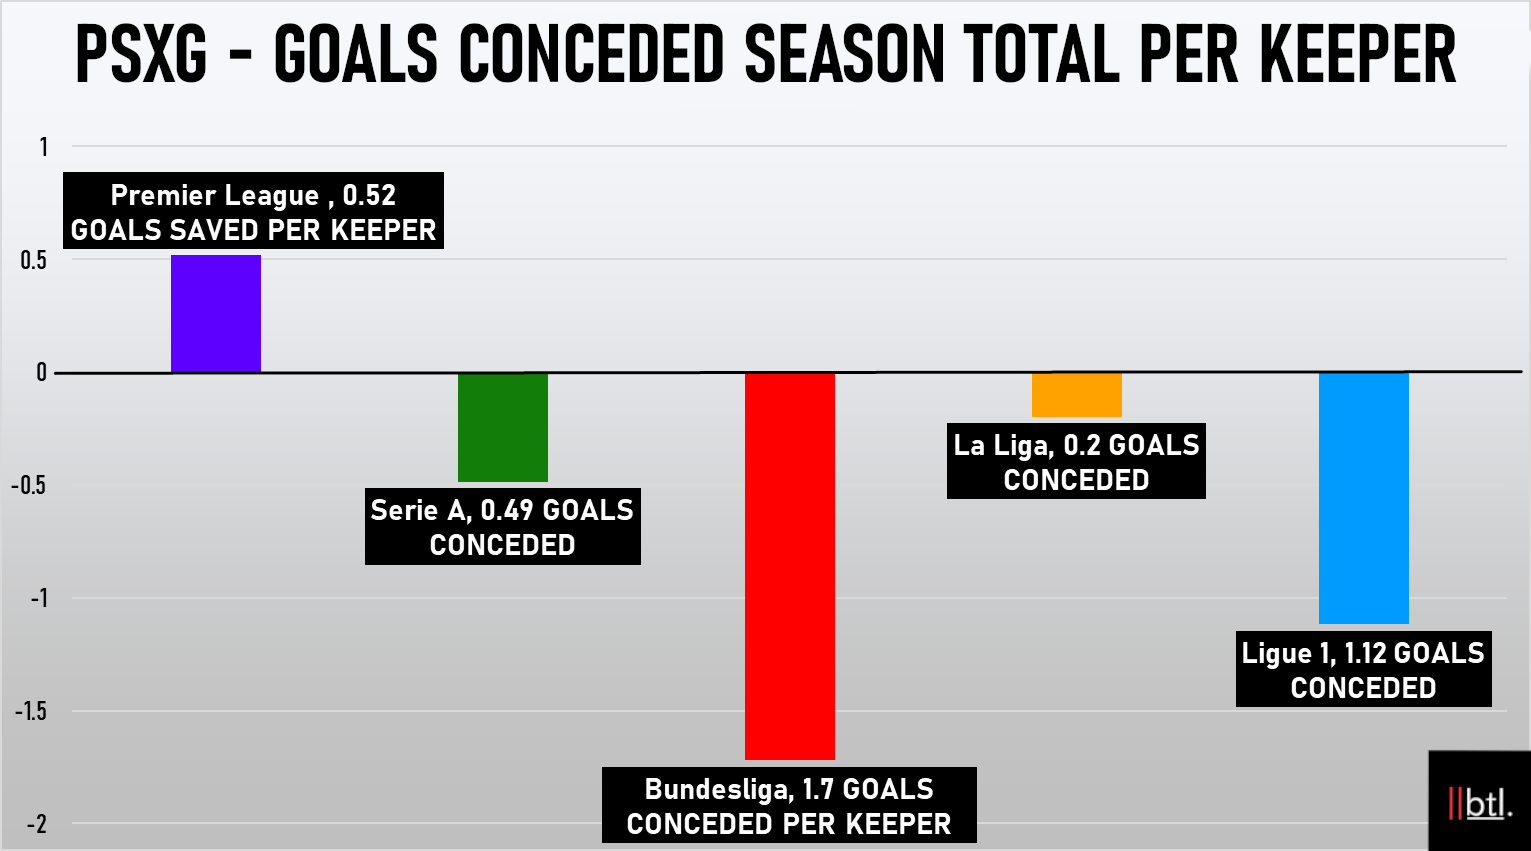
PSXG minus Goals Conceded for leagues average keeper; bar above ‘0’ indicates positive goalkeeping, below ‘0’ indicates negative goalkeeping. Vertical axis; PSXG minus Goals Conceded.
The Premier League’s goalkeepers are the only ones in Europe to concede fewer goals than they are expected to. Every other league in Europe finished with a negative value.
In fact, Ligue 1 and the Bundesliga finished negatively every year in our study, with the Germans finishing up as the worst goalies in Europe’s top 5 leagues by our metrics standards. Bundesliga goalkeepers conceded on average 1.7 goals per season more than they should have, almost 2 goals more than Premier League goalkeepers.
Distance from Goal per Shot
Here we calculated the distance from goal shots were taken from each team in each league. For example, last season no team in Europe took their shots closer to goal on average than West Ham (15.4 yards). FC Metz in France however, took their shots on average from 20 yards out, meaning they often shot from outside of the penalty box.
This is designed to see how efficient the teams in each of these leagues are with their shots. Taking long shots is wasteful; the closer to goal, the greater the chance of scoring.
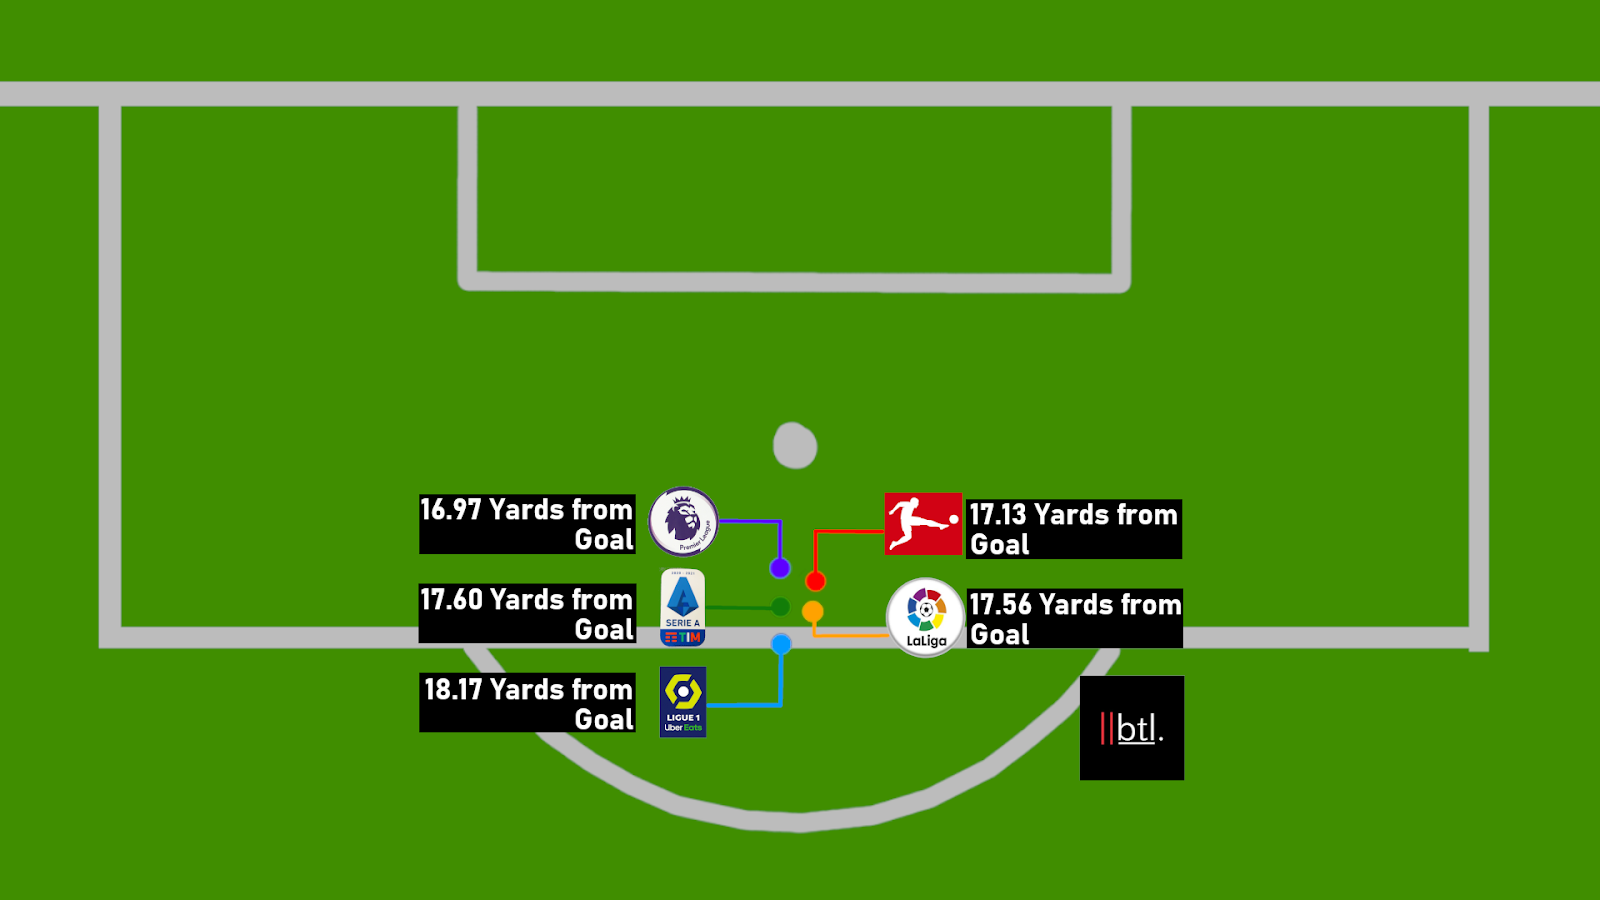
Blotch indicates distance from goal shots are taken on average in our study (Across every team in each league since 17/18).
As seen above, no one in Europe’s Big Five takes their shots from further out than Ligue 1’s teams. Every other league is within the boundary of the 18-yard penalty box. Combine this with the goalkeeping data, and Ligue 1’s keepers may be just as bad as the Bundesliga’s; they are facing shots from further out but still conceding at a poor rate. The Premier League meanwhile, not only has the best goalkeepers in Europe but they also take their shots from the shortest distance, which bodes extremely well for team quality.
Pressing vs Errors
There are several factors that can cause an individual error in football, but intense opposition pressure is amongst the most prevalent causes. Applying intense pressure is currently the top weapon used by some of Europe’s best coaches, with examples including Jürgen Klopp’s Liverpool and Julian Nagelsmann’s RB Leipzig. We calculated the average amount of errors a team from each league commits per season, and mapped it with the average amount of pressures-per-90.
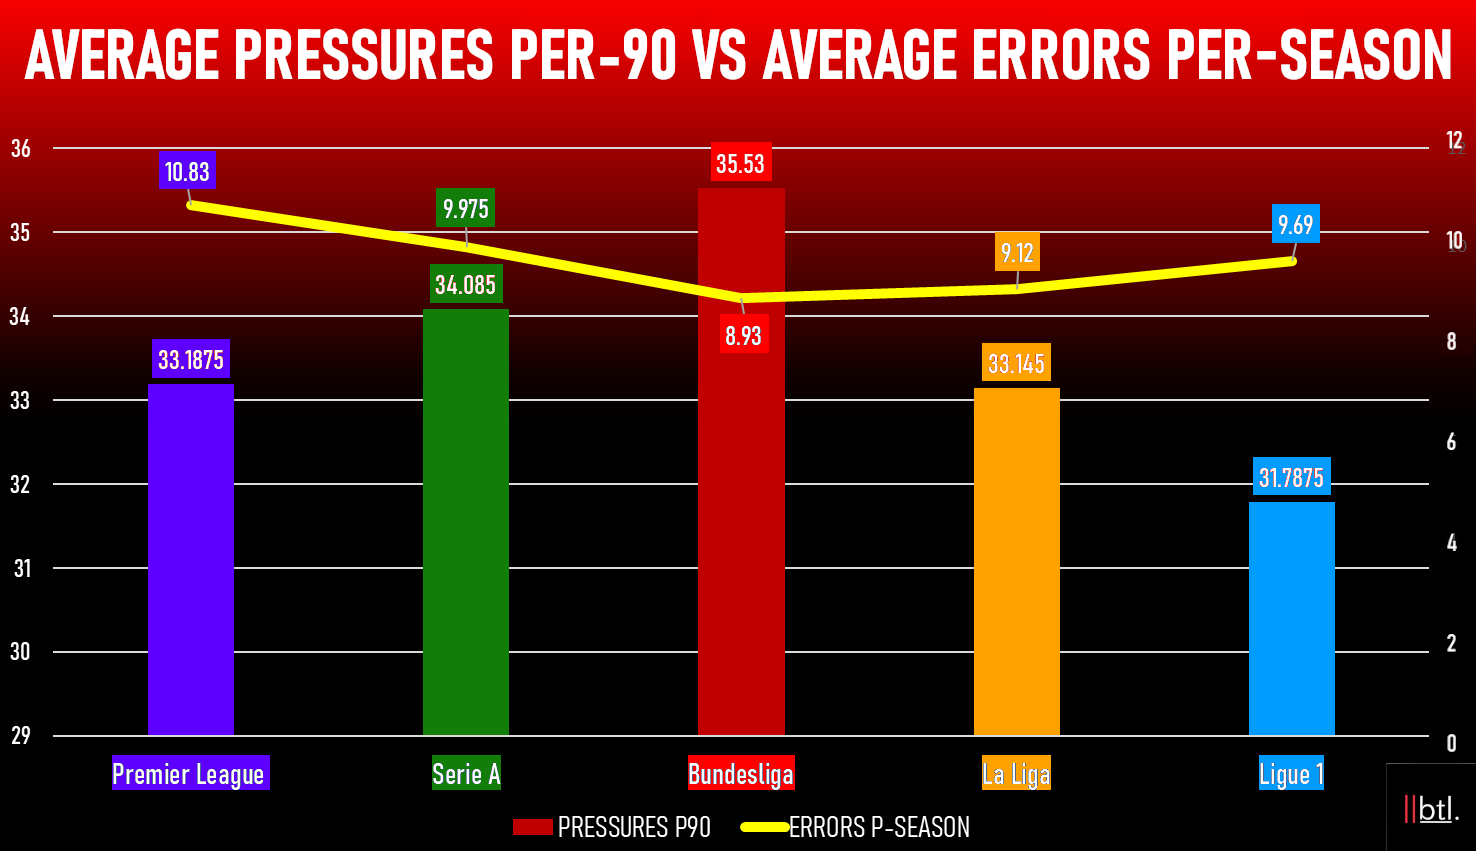
Pressures p90 (bar) mapped with average team errors per season total (Line). Left-Vertical axis; Pressures p90. Right vertical axis; Errors per season.
This data shines incredibly well on the Bundesliga. Not only do they press the hardest in any of Europe’s top 5 leagues, but they also committed the least errors per season. Their goalkeeping quality may be poor, but their players are by far the best under pressure.
There is a side note for Ligue 1 fans. After a particularly low score for 2017/18, their pressure numbers have fallen in line with their European counterparts. While on average they press the least, they have amended this metric in recent seasons. Ligue 1’s rise is definitely a note to revisit when repeating this study in a few years' time.
Another interesting takeaway is the fact the Premier League committed the most errors in Europe through this data. It is a statement made more intriguing by the fact the Premier League sits way behind the Bundesliga and Serie A for pressures p90. Perhaps it’s due to the tight English Christmas schedule, with consecutive games causing tired bodies to be more susceptible to error. Whatever the reason, the Premier League ranks the worst here.
Wage + Age
As detailed extremely well in the book Soccernomics, teams that spend the most in wages often do the best on the pitch. Therefore, it was worth examining the order of spending in the Big Five, taken from Statista’s 19/20 studies on each team’s average (Yearly) salary paid-per-player.
To make it more informative though, we calculated the average age per league, based on Transfermarkt’s average age by players used for each of the past 4 seasons. Now we can better understand what leagues are spending their money on.
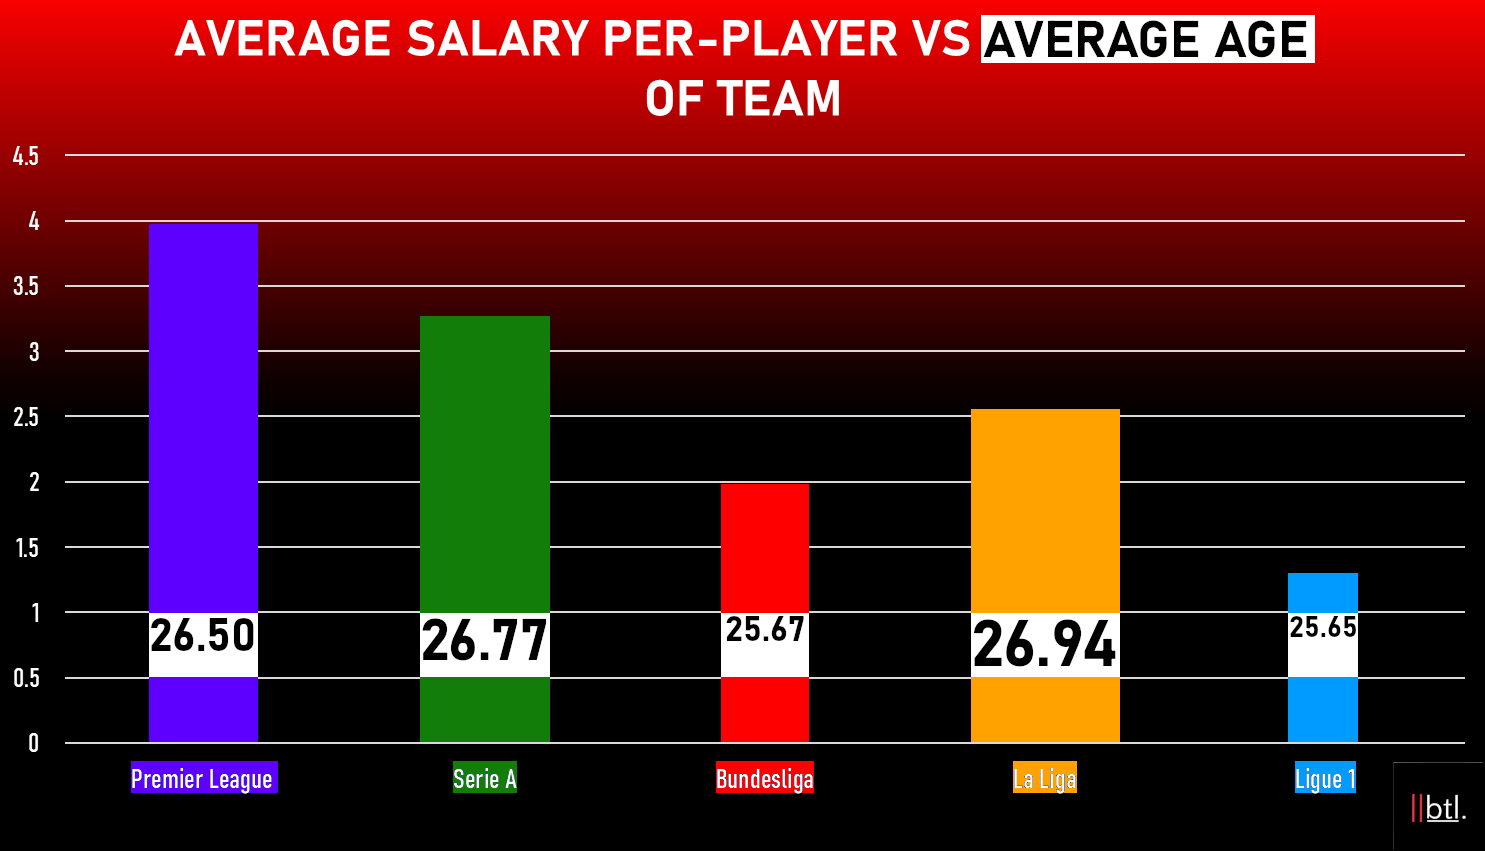
Average salary per player from 2019/20 (In millions, vertical axis) vs Average age across study (Shown in white boxes + Width of bar).
A player’s prime age depends on his position, but besides goalkeepers, it’s generally the mid-to-late twenties. The Premier League’s average age of 26.5 fits best into this category. Combine this with the fact they are the highest spending league, and the eye test is backed up; The Premier League brings in the players in their prime years, which subsequently costs the most money.
The data between the categories compliments each other well. The older you get from the Premier League, in Serie A and then La Liga, the more the wage spending decreases. This trend is also visible in the two divisions relying on younger squads, although it is noticeable that Ligue 1 is spending over half a million less per player on average than the Bundesliga.
Ranking the Leagues
Though the quality has risen in recent years, Ligue 1 is still the weakest of the Big Five. Their poor shot-distance score is damaging, as well as the lack of pressing and goalkeeping quality. They also spend the fewest of any league. They are certainly heading in the right direction though, as pressures p90, shot distance and error numbers have all improved since 17/18.
Serie A would likely rank fourth or third. They only come in the top two for one quality measure: pressing. Their teams are yet to catch up with the Bundesliga in coping with that pressure though, committing the second-most errors on average per season. Considering Serie A is spending the second most on salary in Europe, their statistics in this study ranked quite low.
La Liga are in tight contention with Serie A. They have the second-best goalkeeping standard in Europe. They also commit the second least amount of errors and take their shots from a decent range. The worrying take away however is that La Liga is the oldest of the big 5 leagues, and in 20/21 their average age was 27.2.
In fact, there were 6 Spanish teams last season that had an average age of 28 years or older. For comparison, only Burnley and Crystal Palace were at that mark in England, whilst no side in France or Germany marked higher than 27.4. That may also explain La Liga’s huge decline in pressure numbers since 17/18, from 36.27 p90 to 30.96 in 20/21.
https://twitter.com/EuroExpert_/status/1420434601521131523?s=20
The Bundesliga shone very well in this study. Though they spend the second least on salary, their players are the least error-prone in Europe, and also the best pressers. They are the second-best for shot distance too. It’s just their goalkeeping that lets them down. It lends credence to the term “Bundesliga Tax”, as you can reasonably expect a player to score 2 more goals across a season in Germany than in the Premier League.
The Premier League is clearly the highest quality league here. They finished top in shot distance, top in Goalkeeping standard, they had a very strong average age, and they spend the most on their players too. The only awkward takeaway is that they are spending the most money, on the most error-prone players.
The Bundesliga and Serie A sides both exert more pressures p90, and they handle it much better than Premier League teams do. While English football comes out well in the study, it’s a nice footnote to show it’s not as dominant as sometimes suggested. By no means is this the perfect study. There are lots of factors that could have influenced the data, like Ligue 1’s curtailed 2019/20 season, or the fact the Bundesliga fields two fewer teams than any of these leagues.
The differences between these leagues, particularly in average age, are very minimal too. The ranking at the end is still a subjective interpretation of the data collected too. Other analysts may find differing conclusions from our results. However considering the existing answers for the question at hand, this study offers up some of the best results you can currently find. Perhaps it can be the basis for a further study, and possibly one that even includes leagues outside of the Big Five.
Credits
Words
Alex Barker
More from Breaking The Lines coming soon.
Visit the profile to follow and get notified when the next piece lands.