
Efficient Possession Ratio: A New Football Performance Metric
While writing my recent article entitled Why Sean Dyche Deserves More Credit, I scoured the internet for a statistic to support my claims about the potency of Everton’s counterattack last season, only to find one did not exist. Thus, I created one of my own and named it the “Efficient Possession Ratio”, or EPR.
Although this idea started as a simple calculation that I’d use for nothing more than a singular piece of evidence in one of the hundreds of data-driven football articles I’ve written, I realized quite quickly that this metric was worth exploring in more depth. In this article, I will fully examine the strengths, weaknesses, applications, and possible expansions of EPR, and what I’ve learned about football statistics during its development. Let’s dive in.
What is Efficient Possession Ratio?
Efficient Possession Ratio is a football performance metric that seeks to illustrate how much of a certain team’s possession directly contributes to the creation of goalscoring opportunities in comparison to other teams in their league and around the world. In other words, EPR shows how efficient a team is at turning possession into chances.
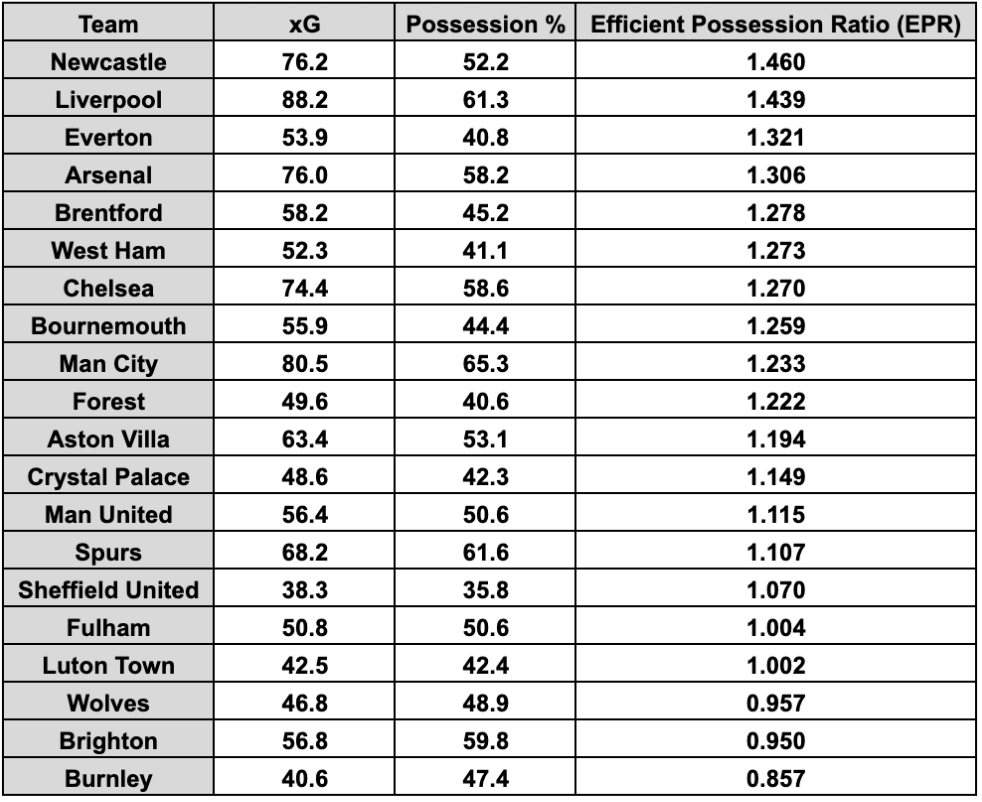
The calculation of this metric is simple: xG / Possession. During the development of the metric, and for the purpose of the Dyche article, I took the xG that every Premier League team created from the entire season and divided it by their average possession across all 38 matches, thus creating a ratio. Below is a chart that ranks every Premier League team by their EPR in the 2023/24 season.
EPR can also be measured for single matches by simply multiplying a team’s xG by 38, the number of games in a full Premier League season, and the standard I adopted during the development of this statistic.
Does EPR Indicate a Team’s Success?
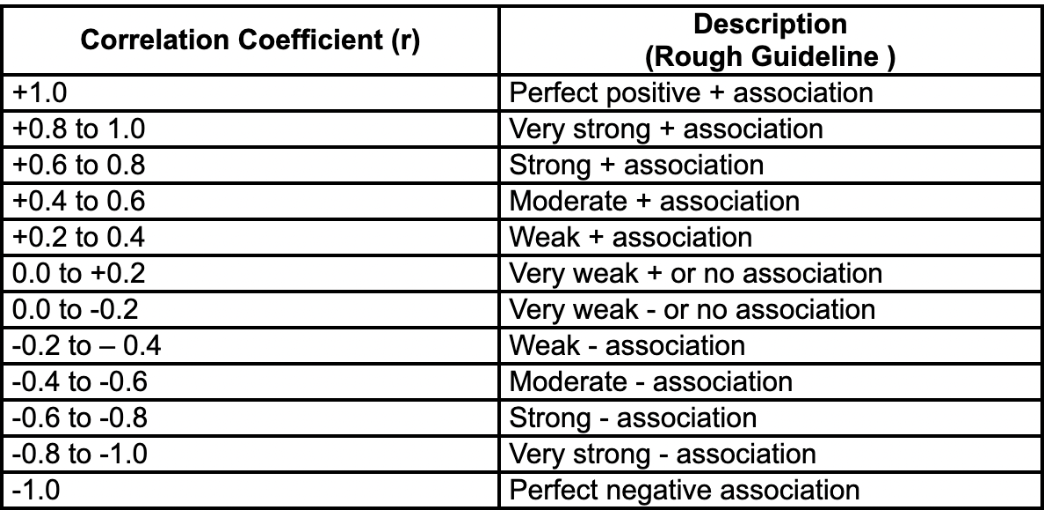
Yes and no. Firstly, let’s go over the context necessary to give a full answer to this question. For those unfamiliar with mathematical statistics, a correlation is “a quantity measuring the extent of the interdependence of variable quantities”. In layman’s terms, correlation shows how related two sets of data are to each other. We can quantify this through a correlation coefficient (r), which runs from -1 to 1. The chart below from Boston University shows how to interpret each r-value within that range.
In the Premier League this season, EPR and Points Earned had an r-value of 0.55 when correlated; a moderate positive association. Therefore, it is generally preferable for a team to have a higher EPR. The most ubiquitous stats in football all have stronger associations with Points Earned than EPR, however. The table below compares these metrics’ association with Points Earned during the 2023/24 Premier League campaign.
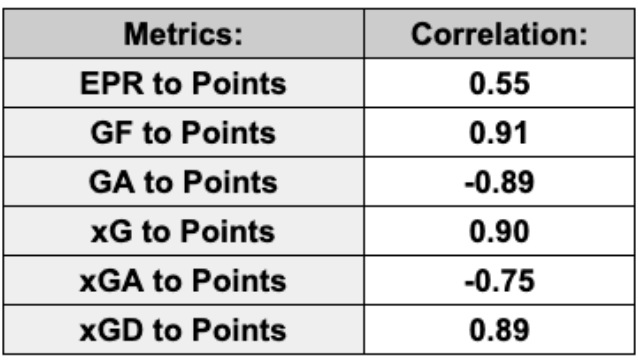
Please note that GA to Points and xGA to Points have strong negative correlations because successful teams concede fewer goals, not more. Although EPR doesn’t stack up to these other established metrics in terms of its association with success, that is not its goal. Rather, EPR can illustrate something that these others do not: how a team attacks.
At the bottom of the EPR chart, we see teams like Brighton and Burnley, who played methodical possession football and often opt not to play forward. At the top, we find teams like Newcastle and Liverpool who played high-octane forward-first football. While most football performance metrics tell us what, EPR can tell us how. We’ll revisit this later.
Does EPR Favor Teams Who Play Direct?
This is a valid question to ask when you see teams like Everton, Brentford, and West Ham all within the Top 6 for EPR in the Premier League last season. I thought of this myself and found a way to test it.
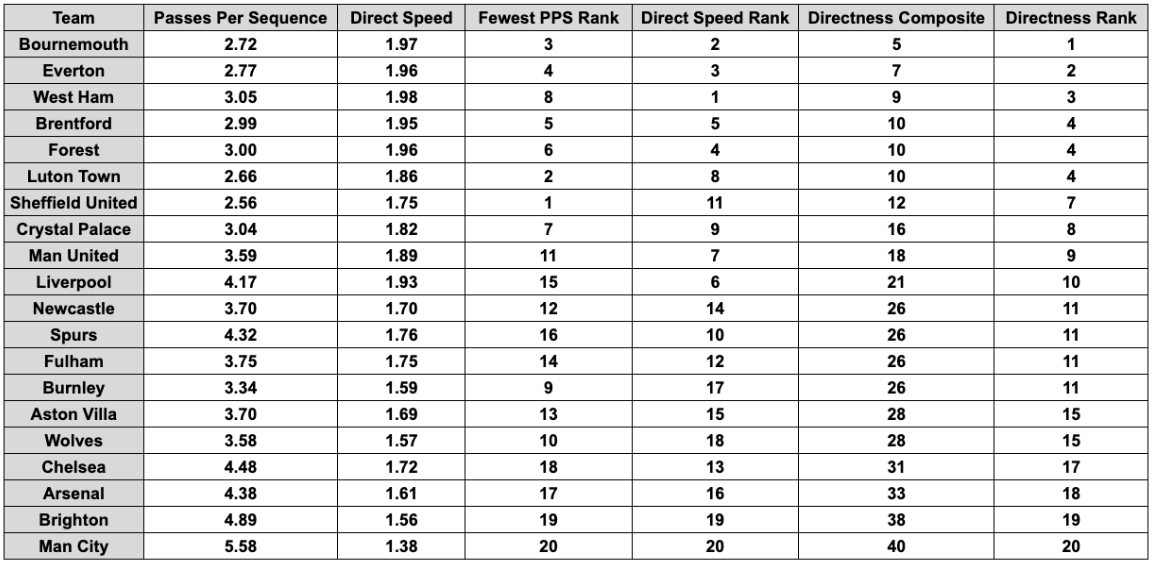
As shown in the table above, I decided to measure the directness of a team through two measurements: Passes Per Sequence and Direct Speed. These two metrics have a correlation coefficient of 0.70, so they are strongly associated but do not describe the same facet of a team’s play.
To combine these two stats and weigh them equally, I ranked the teams from most direct to least in each stat and then combined the rankings to create an overall directness rank. When correlated to EPR, directness rank has a r-value of -0.16, meaning there is little to no association between how direct a team plays and how high their EPR is.
How is EPR Affected by Set Pieces?
Set pieces are a crucial source of chances for many teams, especially those towards the bottom of the standings. Those chances can be created irrespective of the efficiency of a team’s possession, so I knew I needed to test whether EPR included bias towards teams who rely on set pieces to create a large proportion of their xG. As a result, I created two new variants of EPR: Open Play EPR (opEPR) and Set Play EPR (spEPR).
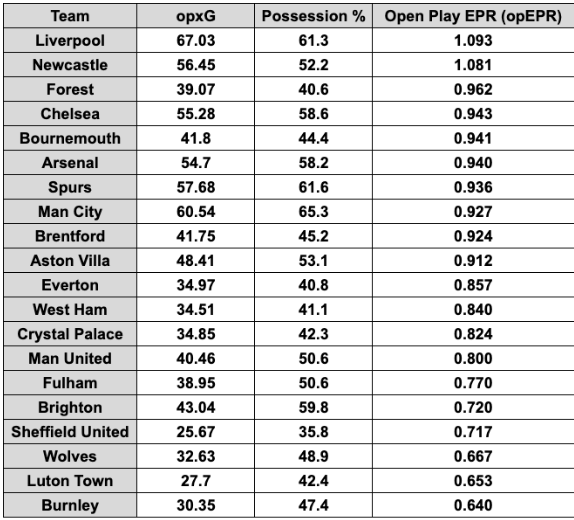
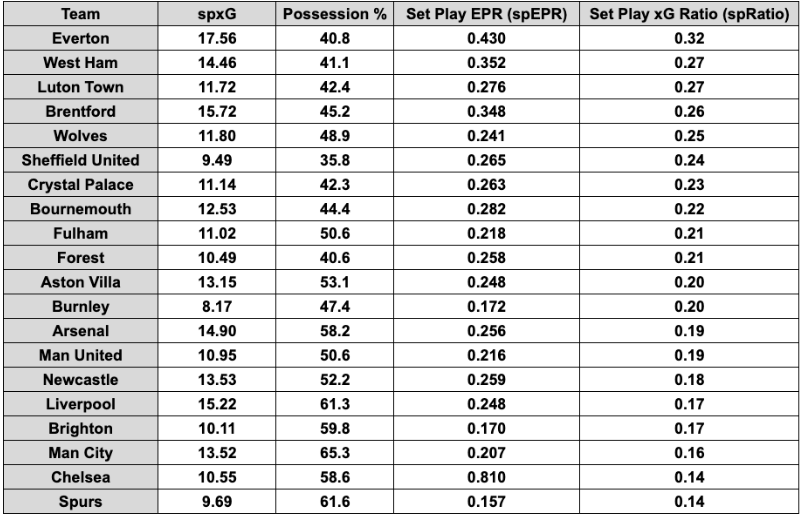
The first table shows opEPR, where only a team’s xG created from open play is accounted for, while the second shows spEPR, where only a team’s xG from set pieces is accounted for, not including penalty kicks. The second table also includes every team’s Set Play xG Ratio, which is the proportion of a team’s xG that they generated from set pieces. Now, let’s look at the correlation between each of these metrics and EPR.
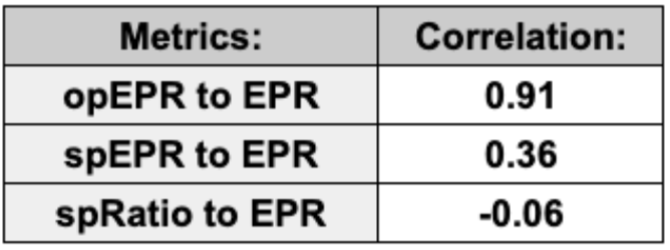
As you can see, opEPR is significantly more indicative of EPR than spEPR is, and there is essentially zero correlation between EPR and Set Play xG Ratio. This means that EPR is not biased towards teams who rely on set pieces more than others.
Additionally, when we correlate spxG to EPR, the r-value comes out to 0.73, while opxG comes out to 0.61, indicating that teams who create the most from set pieces overall may be favored slightly, but that’s unsurprising considering that teams with more xG are likely to have higher EPRs and set-pieces are possession-independent opportunities to create chances.
How Does EPR Compare Across Different Leagues?
So far, we’ve only looked at EPR’s application to the Premier League, but play style and quality differ from league to league, so I calculated the EPR of every team in each of the top 5 European Leagues to see how they compare. Please note that statistics for the Bundesliga and Ligue 1 were standardized to 38 games.
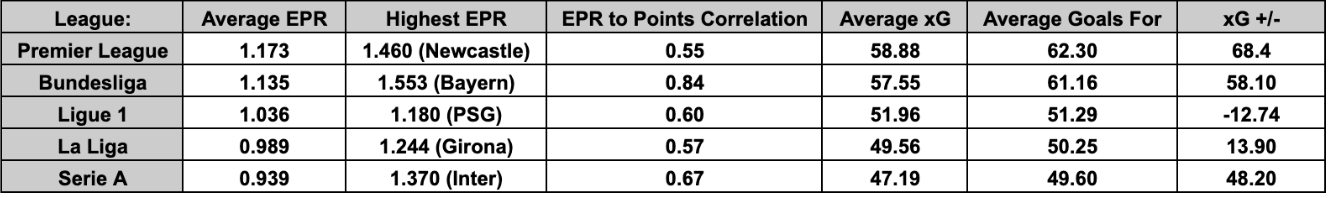
The Premier League had the highest average EPR across all its teams of any of the top 5 leagues, which is unsurprising considering Premier League football is often characterized as more dynamic and intense than others. Spain and Italy, on the other hand, are well known for possession-oriented philosophies that do not value swift attacks nearly as much, and that is reflected in their average EPR as well.
As you can see, there is still a strong correlation between EPR and Points across all these leagues despite the differences in style of play, indicating the strength of the metric. Surprisingly, the Premier League had the weakest correlation between EPR and Points of the five, while the Bundesliga harbored a staggeringly high 0.84 correlation coefficient. For reference, that is the same value as the correlation between xGD and Points in the Bundesliga, and indicates a stronger correlation than GA to Points in both La Liga (-0.75) and Ligue 1 (-0.79).
This high value may be due to this season’s Bundesliga possessing an unusually high correlation between Possession and Points (0.90), while the other leagues averaged around 0.75, but Ligue 1 also had a very strong association (0.84) yet did not foster such a high correlation between EPR and Points.
I also took a look at the EPR to Points correlation in the Bundesliga the season before (2022/23) and that value came out to 0.74 despite the Possession to Points coming in at a much lower 0.69, so it’s still unclear as to why EPR is particularly applicable to the Bundesliga.
Although I initially wondered whether the Premier League’s absurd xG overperformance this season was the reason behind it having the lowest correlation between EPR and Points, the Bundesliga and Serie A also saw many more goals scored than expected, yet maintained high correlations.
Part of this can be explained by a few outliers, as removing Manchester City, Everton, and Brentford (the three teams with the largest difference between their EPR rank and final table position) brings that correlation value up to 0.64. In fact, the Premier League is the only one of the Top 5 Leagues where the League Champions did not rank in the Top 4 of EPR.
To summarize this section, EPR accurately reflects the difference in playing conventions across leagues and is even more associated with a team’s success in other leagues than in the Premier League.
How Can EPR Be Employed?
Now that we’ve fully explored EPR and what it indicates, we can use it to compare a few different teams. Let’s start with Liverpool and Spurs.
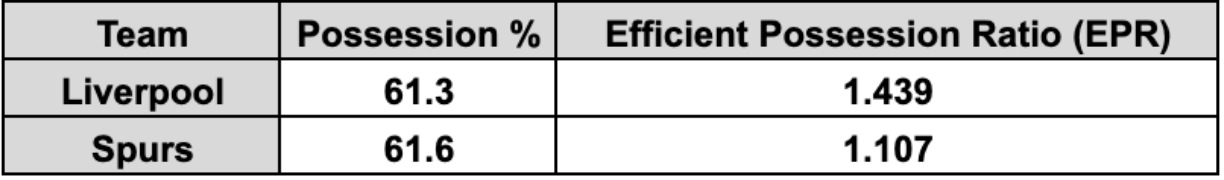
All we need to make a base-level assessment is each team’s possession percentage and EPR. Although these two teams had a nearly identical amount of possession across the season, the difference in how they attacked is made immediately apparent by EPR. Liverpool were very efficient at turning their large volume of possession into a large volume of chances, while Spurs struggled to capitalize on their possessive dominance.
We can deduce from these two numbers that Liverpool could effectively play through the lines and efficiently convert possession to chances, while Spurs’ possession was often restricted to their defensive third or the middle third, and they were much less effective at pulling out and breaking down low-block opponents.
Other data supports the assessment that we just made. Spurs and Liverpool ranked 5th and 6th respectively in passes per sequence with very similar numbers, but Liverpool’s direct speed was only bettered by the exact teams who composed the Top 5 in the Directness Ranking I referenced earlier, while Spurs ranked mid-table.
This shows that Liverpool were much more effective in quickly moving the ball down the pitch, just as we suspected. This is also supported by the fact that Liverpool completed the 2nd most long balls behind only Manchester City, while Spurs ranked 19th only above Sheffield United.
Now that we’ve used EPR to compare two teams with similar possession, let’s compare two teams with a similarly low EPR.
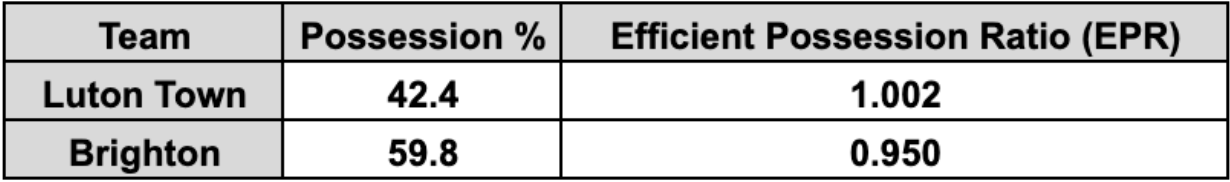
Luton and Brighton ranked 17th and 19th in EPR respectively, but fall towards the bottom of that table for very different reasons. Brighton were very methodical in their build-up and often favored keeping the ball rather than forcing it forward to create an opportunity. 59.8% possession on average is extremely high for a mid-table side, but similarly to Spurs, they struggled to play through the lines and break opponents down.
According to Opta, the Seagulls averaged the second most passes per attacking sequence only behind Manchester City, yet didn’t create much more xG than teams like Bournemouth and Everton who were two of the most direct teams in the league. As a result, their EPR only bettered Vincent Kompany’s Burnley, who are examples of the same problem.
Luton, on the other hand, had a low EPR and low possession, which simply points towards an inability to keep the ball and an inability to create chances even when they do. Although their EPR slightly bettered Brighton, it’s very safe to say their attack was significantly worse, as they kept way less possession, and created 14.3 fewer xG.
Outside data tells us that the Hatters averaged the second least passes per attacking sequence, and despite attempting the third most long balls in the league, their direct speed only ranked 8th, well behind the teams who were effective with their direct attacks.
To summarize, with as little as just a team’s possession as context, EPR can be used to evaluate a team’s ability to convert possession into chances as well as their style of passing and method of attack, and can also be used as a supplementary statistic for larger scale assessments.
What Are The Limitations of EPR?
As with any metric, EPR can be misleading if the proper context is not applied. For example, should we look at two teams’ EPR without seeing their respective average possession, we could be made to believe that those teams played a similar style.
The comparison we made between Brighton and Luton Town serves as a perfect example; these two teams had a very similar EPR but played two completely different brands of football. Another example, this time towards the top of the chart, could be Arsenal and Everton, who both registered impressive EPR but did so in totally different ways.
Apart from possession, additional context must also be considered when evaluating a team using EPR. Manchester City, for example, ranked 9th in EPR in the Premier League this season despite scoring the most goals. There are a few reasons for this; most notably their impressive xG overperformance.
City scored 96 goals from just 80.5 xG, and since their attackers were so efficient in their finishing, they simply didn’t need to be as efficient with their possession. They were also often in situations where they were already up by a few goals early in the game and didn’t need to create anything with their possession, but rather keep the ball and milk the clock.
Finally, the importance of volume must be accounted for when using EPR to evaluate a team. Although EPR may suggest that one team’s attack is better than another, the point of the metric is that it ignores overall volume, which in reality is extremely important.
Brentford may have registered a higher EPR than Chelsea, for example, but Chelsea created more xG, had more possession, and scored more goals, so we cannot reasonably assume that Brentford’s attack was more productive than Chelsea’s just because it was slightly more efficient relative to possession. For EPR to be useful, the proper context must be applied, and the user must understand the purpose and limitations of the metric.
How Can We Expand Upon EPR?
After initially developing EPR, I decided to apply the same principle towards the opposite function: defending. There’s a classic football cliché that goes, “If you don’t have the ball, you can’t score”, and in the same way, if your opponent doesn’t have the ball, they can’t score.
Teams use possession not only as a tool to attack but also to defend. And so, using the same concept as EPR, I decided to measure how much a team relies on possession to defend compared to others. I called this new metric the True Defending Ratio, or TDR.
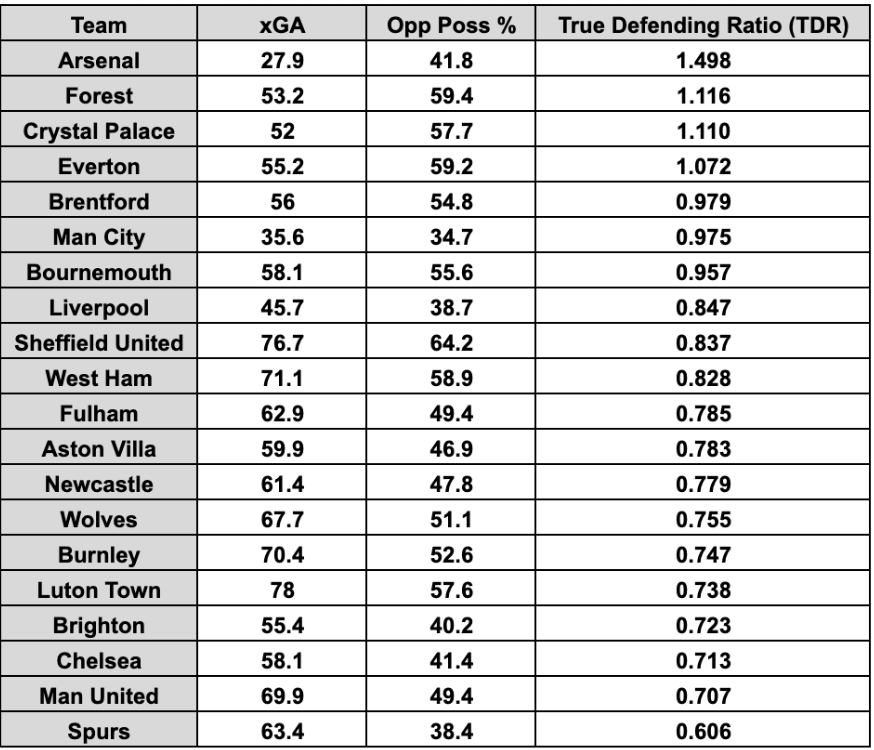
When creating TDR, I followed the same convention as EPR in terms of a higher TDR being better than a lower one. To achieve this I had to reverse the formula due to a lower xGA value indicating a better defense, and so TDR’s formula reads as “Opponent Possession divided by xGA” as a result.
TDR exhibited a much weaker correlation to points than EPR in the Premier League this season with a coefficient of just 0.26, but just like EPR, it can tell us information about how a team defends that other metrics do not. For example, we can see that Spurs allow a very disproportionate amount of xGA when compared to the fact that they only have to defend for 38.4% of the game.
Another way to think of TDR is as “EPR Against”, as the fact Spurs concede so many chances to their opposition despite allowing them a small percentage of possession means they are allowing their opponents to register a high EPR against them.
TDR also shows us that teams like Forest, Crystal Palace, and Everton all defended quite well considering the amount of time they spent without the ball, and therefore the large amounts of pressure they had to soak up. Once I created TDR, it only seemed right to add EPR and TDR together to see what would happen. Thus, the Efficiency Ratio Composite (ERC) was born.
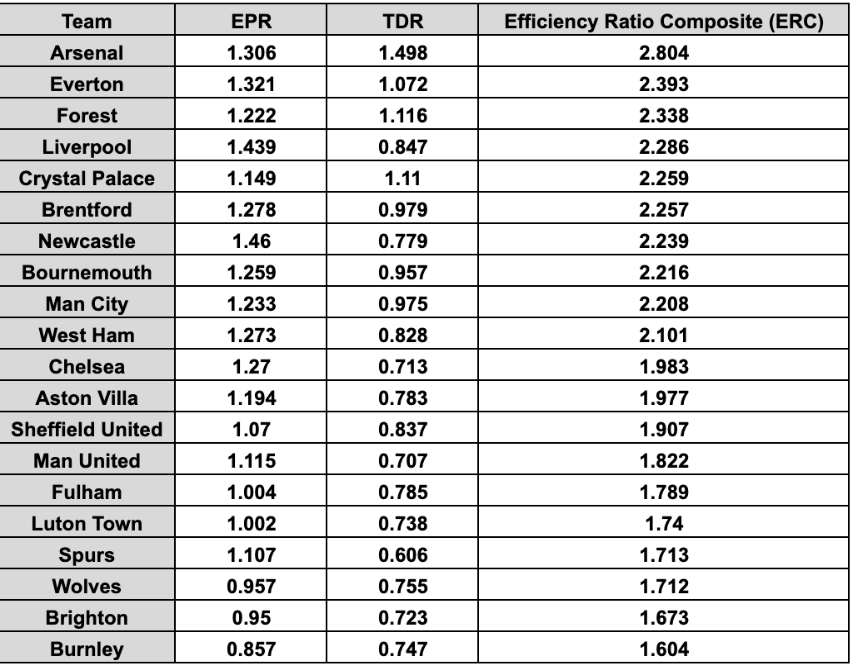
ERC has a coefficient of 0.46 when correlated to points, which indicates a moderate association. One important thing to note is that ERC is weighted more heavily towards EPR because the average EPR this season was 1.173, while the average TDR was just 0.878.
It’s no surprise that Arsenal tops this list, as they ranked 4th in EPR and 1st in TDR, indicating the incredible efficiency that Mikel Arteta had his team operating with in all phases of the game during the 2023/24 season. In the future, I plan to look at TDR and ERC across other leagues as well, but for this article, we’ll leave them at that for now.
Conclusion
To summarize, Efficient Possession Ratio is a metric that quantifies the efficiency of a team’s possession into a single number that can be used to evaluate a team’s attack with little other context. It is relatively indicative of a successful team and is not biased towards teams who play directly nor teams who rely on set pieces to create chances. Further research about EPR across different leagues and different seasons may uncover more about the strengths and weaknesses of the metric in the future.
By: Garrett Post / @ParrettGost
Featured Image: @GabFoligno / Catherine Ivill / Getty Images